How to Analyze NASDAQ Stock Volatility: A Data-Driven Guide
MarketRoom Team
Content Writer
The NASDAQ exchange is synonymous with innovation, growth-oriented technology, and, inevitably, significant price movement. For retail investors and finance enthusiasts, learning how to analyze NASDAQ stock volatility is an essential skill for understanding the landscape of high-growth markets. Volatility is not inherently negative; it is a measure of how frequently and how sharply a stock's price fluctuates. However, managing this information requires a structured approach that moves beyond simple chart watching.
Establishing a Framework for How to Analyze NASDAQ Stock Volatility
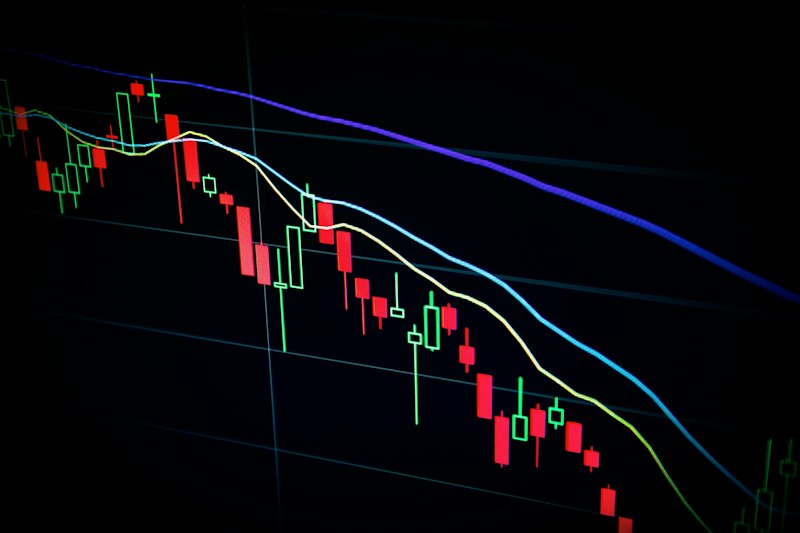
To effectively assess volatility, investors must look at both historical data and forward-looking sentiment. Analyzing price swings requires more than just a quick glance at a candlestick chart.
- Define your time horizon: Determine if you are analyzing intraday fluctuations or longer-term cyclical volatility. NASDAQ stocks often exhibit high beta values, reflecting their tendency to move more aggressively than the broader market.
- Utilize statistical measures: Standard deviation and Average True Range (ATR) are the bread and butter of volatility analysis. These metrics help quantify the 'normal' range of movement for a specific ticker over a set period.
- Contextualize with macro factors: NASDAQ stocks are highly sensitive to interest rate changes and Federal Reserve policy. Monitoring these external forces is vital because they often act as the primary catalysts for periods of heightened market instability.
- Leverage AI-driven research: Modern tools allow investors to aggregate complex data points quickly. Platforms like MarketRoom.ai provide an Automated Stock Consensus Verdict Explained: How Multi-Agent AI Works, which helps clarify how different analytical perspectives interpret market noise.
Advanced Methods for How to Analyze NASDAQ Stock Volatility
Once you have a baseline, the next phase involves drilling down into the specific drivers of a company's price action. Sophisticated market participants look for divergences between price action and underlying fundamental health.
- Segment by sector and cap: Not all NASDAQ stocks move the same way. By Mastering the Market: A Comprehensive Guide to Screening US Stocks by Market Cap, you can isolate volatility patterns that are characteristic of large-cap tech versus emerging biotech or small-cap software providers.
- Incorporate multi-agent analysis: When examining volatility, consider using systems that simulate diverse viewpoints. At MarketRoom, 8 independent AI agents—including macro strategists, growth investors, and even contrarians—debate the implications of market movements, offering a multi-faceted research view rather than a single metric output.
- Track price targets over time: Monitoring how analysts adjust their expectations provides a proxy for volatility. Utilizing Precision AI-Powered Stock Price Target Tracking for Market Analysis can help you visualize how the 'consensus' view of a company's future value shifts as market conditions change.
- Monitor earnings and catalyst dates: Most volatility in NASDAQ stocks clusters around earnings announcements. Tracking these dates allows for a clearer understanding of whether price swings are driven by speculative trading or genuine shifts in corporate performance.
H3: How does AI change volatility analysis?
AI-powered platforms can process thousands of data points—from balance sheets to Fed transcripts—in seconds. This allows for a deeper level of research that accounts for both quantitative metrics (like standard deviation) and qualitative inputs (like sentiment analysis).
H3: Can I predict future volatility?
While no tool can predict the future with certainty, researching historical trends, market beta, and macroeconomic sensitivity can help investors understand the potential risk profile of a stock. MarketRoom provides AI-generated research outputs to help frame these discussions.
H3: Is NASDAQ more volatile than the NYSE?
Generally, the NASDAQ is home to technology and growth stocks, which are often more sensitive to macroeconomic cycles, potentially leading to higher realized volatility compared to more defensive sectors often found on the NYSE.
H3: How should I interpret AI consensus verdicts?
AI verdicts, such as those produced by the multi-agent debate process at MarketRoom, are informational research signals. They represent an aggregation of data-driven arguments and should be used as one component of a broader, independent research process.
H3: What is Beta in this context?
Beta is a measure of a stock's volatility in relation to the overall market. A beta greater than 1 suggests the stock is theoretically more volatile than the broader index, which is common among many NASDAQ-listed companies.
Conclusion
Learning how to analyze NASDAQ stock volatility is an ongoing process of refining your data-gathering techniques and critical thinking. By combining technical metrics with the multi-agent insights provided by MarketRoom.ai, you can gain a more comprehensive view of the market's behavior. Explore MarketRoom.ai today to see how AI-driven research can assist in your analysis of the stock market.
Disclaimer — Not Investment Advice. The content on this page is provided for informational and educational purposes only. It does not constitute investment advice, financial advice, a recommendation to buy, sell, or hold any security, or a solicitation or offer to invest. MarketRoom is not a registered investment adviser or broker-dealer. AI-generated analysis reflects data and model outputs only and may be inaccurate, incomplete, or outdated. Past performance and AI-generated signals do not guarantee future results. All investments carry risk, including the potential loss of principal. Always do your own research and consult a licensed financial advisor before making any investment decision. By reading this content you agree to our Terms of Service, Privacy Policy, and Risk Disclaimer.
Important Disclaimer
Not investment advice. All content published on MarketRoom — including AI-generated analyses, verdicts, price targets, and articles — is provided for informational and educational purposes only. Nothing here constitutes a solicitation, recommendation, or offer to buy or sell any security.
Past performance is not indicative of future results. AI models may be incorrect, incomplete, or subject to data limitations. Always conduct your own research and consult a qualified financial advisor before making any investment decisions.
MarketRoom is intended for users aged 18 and older. By using this platform you confirm you meet the legal age requirement in your jurisdiction and agree to our Terms of Service, Privacy Policy, and Cookie Policy.